Some tricks about debugging Chromium
Prerequisite
This post isn’t something about setting up debugging environment, so I assume that you have been familiar with that in the official guide. I’d like to focus on some tricks to enhance the experience of exploring such a big code base.
Hardware: the more, the better
Memory
Although Chromium suggests ‘more than 16GB is highly recommend’, I strongly recommend installing at least 32GB memory if you rely on debuggers, either gdb or Visual Studio. For example, on Linux, with the debug level set to 2, the gdb and Chromium itself consume about 7GB memory in total. Meanwhile, my Visual Studio Code takes another 6GB memory. As a result, Linux will soon start to use swap or select a process to kill if there is only 16GB memory installed, which ruins the whole experience.
SSD
Building your Chromium in an HDD partition is okay, but I suggest never trying to debug it. It almost takes forever to load various symbols.
CPU
CPU performance only makes sense when building the Chromium. Simply running or debugging doesn’t consume too much CPU. For my case, i3-9100 works pretty well but R5 2600 will reduce the building time by 2 hours.
Tools: Choose whatever you like
There are a thousand choices for tools out of a thousand people. Here I provide some experience for choosing tools for exploring Chromium.
Linux distribution
STICK TO UBUNTU. Don’t even try Debian, that will bring lots of pain.
Code navigation
The IntelliSense of Visual Studio is the most powerful among all C++ IDEs I have installed and that’s also true for browsing the Chromium code. Basically, it works like a charm all the time. The only but critical drawback is that, although a near 10GB index database has been build, it still takes some time for code reference almost every time even for those in the same source file! Therefore, I recommend loading fewer components with Visual Studio.
The alternative plugin on Visual Studio Code should also work but lots of extra configurations are needed since many *.mojom.h files compiled from *.mojom during building are missing. Sometimes the plugin stops working if there are too many missing headers. I guess a workaround is to build every target related to mojom and add the generated directories to include paths, which seems to be used on Visual Studio. I didn’t verify that solution because most time the code reference works. :p
Also note that find & grep is always your best utilities.
Breakpoints & Bookmarks
Visual Studio allows you to group your breakpoints and enable them by groups, which is one of my favorite features. Besides, I suggest adding remarks for breakpoints or adding bookmarks. During the long time of work, it’s pretty possible to forget previous comprehension and bookmarks are very useful to find some specific code paths quickly.
In addition, never forget to back up your workspace including your breakpoints and bookmarks periodically.
Debugging
I know gdb is much more flexible, but Visual Studio enhances debugging experience in four aspects:
- Better breakpoints management as described before.
- Show real contents of a
WTF::StringorGURLin debug watch. For example, for a variableswhose type isWTF::StringImpl*, you have to calls->Characters8()to get its real content in gdb. Even forstd::string, you have to callc_str(). - Skip trivial functions. See this. There are also some alternative commands for gdb but most time I simply use
until(Run to Cursor). - Support watching and debugging all chromium processes and their subprocesses.
Note that the default debugging log is a good way to know which process the debugger should attach. For example, below is a snippet of logs.
1 | [8918:8918:0618/214818.883632:INFO:render_frame_impl.cc(4231)] Committed provisional load: https://example.com/ |
It shows that the process whose PID is 8918 is a renderer responsible for rendering https://example.com.
Besides, command line arguments is also helpful for distinguish browser and renderers. For example, below is a code snippet to show all renderers per second.
1 | import psutil |
On Windows, ProcessExplorer or windbg can do the exact same thing.
Debugging vs Logging
Logging
Logging means modifying the code to print some crucial variables to logs.
pros:
- No need for debuggers
- Require less memory
- Specific logs can be used to build custom utilities.
cons:
- Rebuilding takes time
- Not so flexible compared to debugging
Sometimes, logging is almost the only choice to meet some specific needs. For example, it’s quite common for researchers to monitor some internal status, which can be easily achieved by logging.
Usually, DLOG or LOG is enough for most cases.
1 | DLOG(INFO) << some_important_variables_; |
See comments in logging.h for details.
Another case is to print stacktrace.
1 |
|
Don’t forget to set proper debug levels in args.gn.
Debugging
Debugging means setting breakpoints and attaching debuggers to the chromium.
pros:
- Much more flexible
- Edit variable without rebuilding
- Switch stack frame easily
- Watch variables
cons:
- Take a large amount of memory
- Long startup time
To be honest, I prefer debugging to logging since tracing back is quite easy and other threads won’t disturb me. By the way, conditional breakpoints are very helpful in some circumstances.
Profiling
As far as I know, the profiling only works on Linux. The profiling tool provided by Visual Studio should also work but I never manage to set it up due to memory outage. Here I only talk about google-perftools on Linux.
Profiling is very useful when you find something time-consuming but can’t find exact code paths. For example, I find pages’ rendering is slow and I get the profiling figure below.
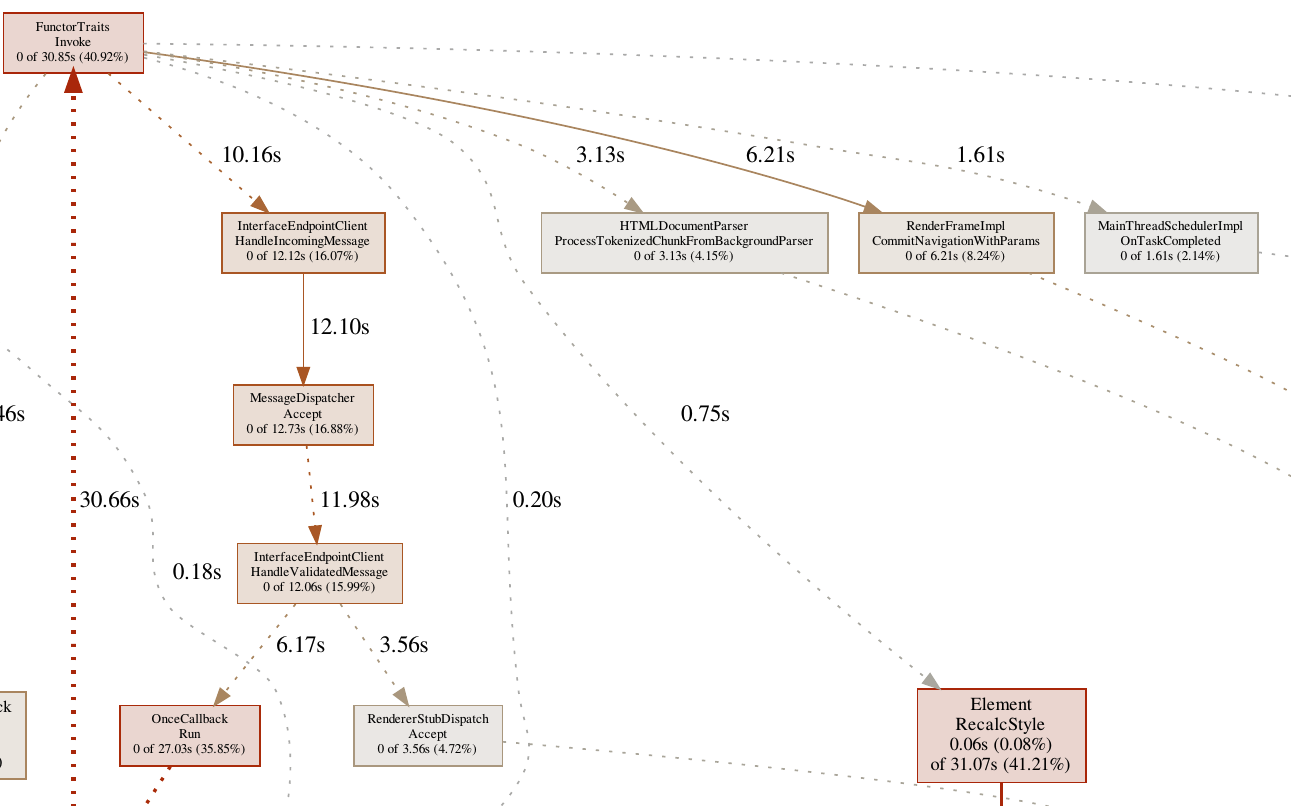
A box represents a function and the more time spent on the function, the bigger the box is. (Note that some functions which consumes a short time are ignored in the figure by default) FunctorTraits::Invoke is a very common function where an asynchronous callback starts, so many functions are derived from it as shown in the figure. Obviously, Element::RecalcStyle takes lots of time, so I’m quite confident that this function is my target and the next step is to add some logs or debugging, which is a good start to explain the reason of slow rendering.
The way to generate such figures is documented at here. Personally, I recommend building two different versions of Chromium, one for debugging and the other for profiling.
Tracing
Tracing is another powerful tool. Below is a quick look.
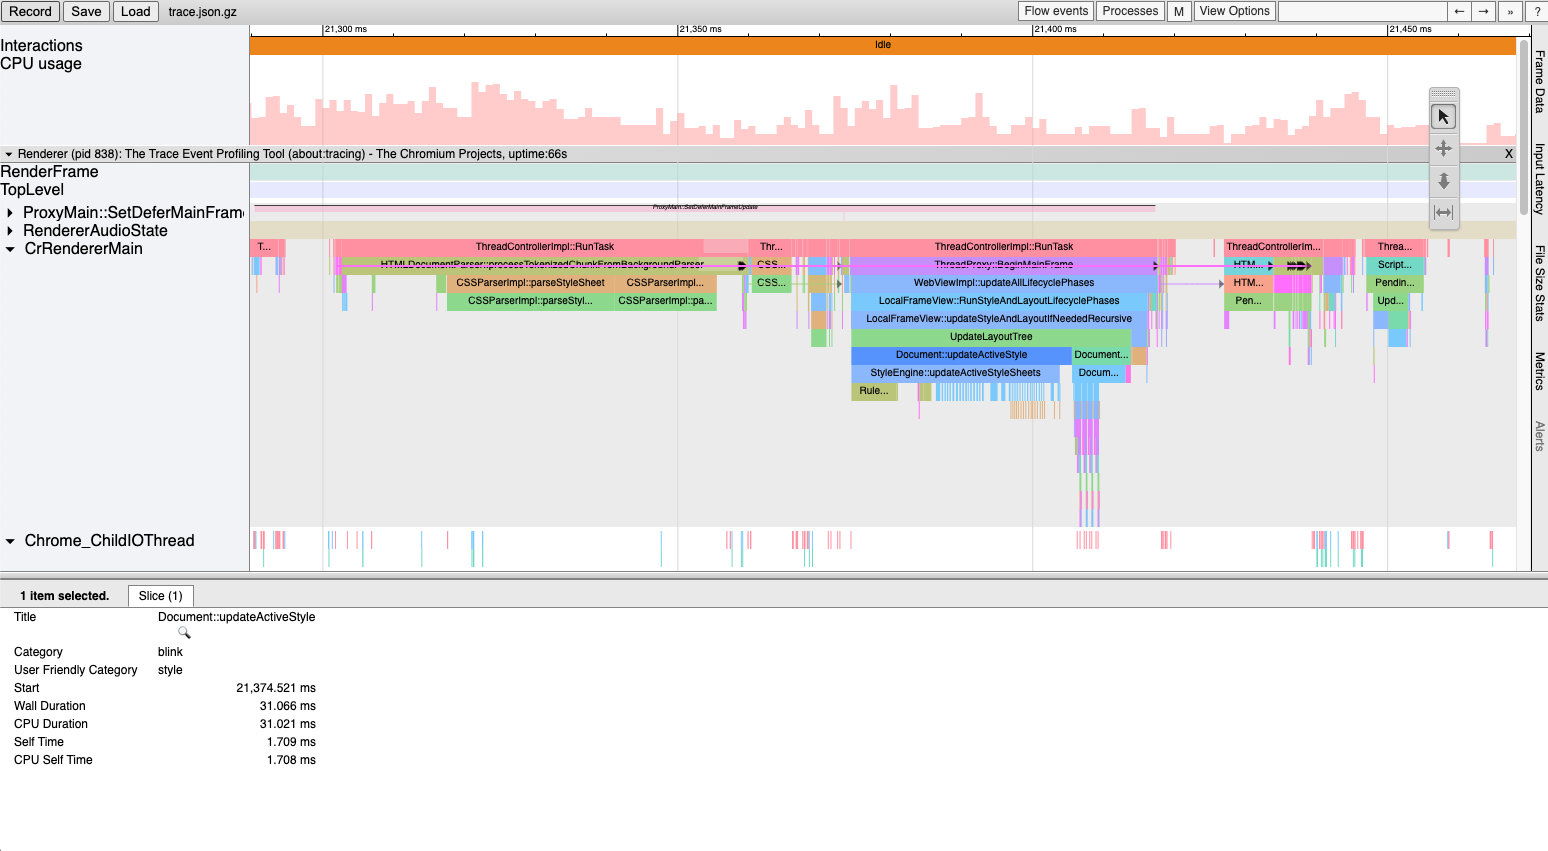
Unlike profiling, a box represents an event in Chromium and parallel events are stacked on the timeline, which means finer granularity. Usually, an event is traced at the beginning of a function. For example, the Document::updateActiveStyle in the figure is defined here.
1 | void Document::UpdateActiveStyle() { |
Except solving time-related problems, tracing is also a great tool to understand how Chromium works. To generate such a figure, simply navigate to chrome://tracing, start recording, do something and switch back to check results. Note that tracing doesn’t need a debug version. Even an official release have bundled the tracing tool.